


The Battle Against Inflation
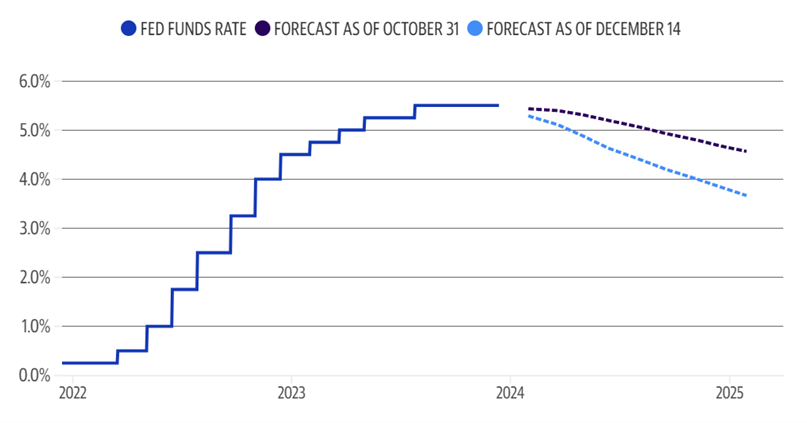
At the beginning of December, Federal Reserve Chairman Jarome Powell was jawboning that rate cut speculation was premature. Half-way through December this changed, with Powell “not declaring victory” on inflation, but signalling through central bank forecasts that the Federal Reserve is likely to embrace more dovish policy in 2024. Most allocators believe that the Fed has reached a terminal rate, as projections indicate that the FOMC expects three interest rate cuts in 2024, for a total compression of 75 basis points (see exhibit below).
Yearly CPI inflation cooled in November to 3.1% from 3.2% in October, driven largely by lower energy costs. Core CPI inflation was more stubborn, remaining unchanged at 4%. Consumers expect inflation to sit at 3.1% in December of 2024 according to the latest consumer sentiment survey from the University of Michigan. This is the lowest level since March of 2021 and a notable decrease from November’s YOY expectations of 4.5%. However, while inflation has ticked down, unemployment unexpectedly declined from 3.9% in October to 3.7% in November through December, compared to expectations of unchanged unemployment. Annual wage growth remained at 4.1% through November and December, roughly on par with Core CPI. Overall, although this is not the textbook signal for a dovish Fed policy shift, this data reinforced the Fed’s soft landing narrative, as inflation has reduced without acutely affecting the real economy.

Landing Softly
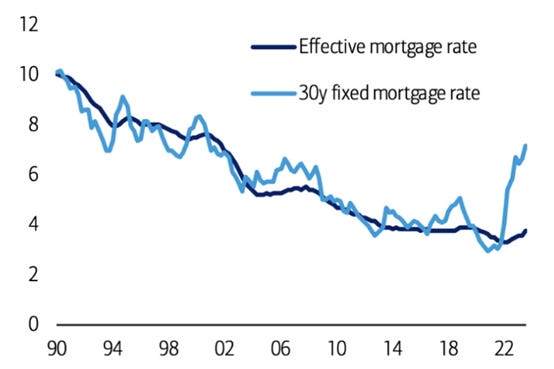
Most analysts predicted very weak growth or a recession in 2023. Historically, an increase in interest rates at the velocity of the latest cycle has almost always caused a recession (at least since the 1970’s). This time, both corporates and households weathered rate hikes efficiently. Instead of a concurrent slowdown, rolling recessions impacted cyclical industries in a staggered fashion which softened the blow of hawkish policies. Savvy treasury managers had already hedged most interest rate risk. Concomitantly, the pandemic-stimulus-backed US Consumer spent more than expected, driving steady growth. While mortgage rates hit their highest levels in more than 20 years, Americans simply avoided the housing market and stayed with their low, already locked-in rates (see exhibit below). These internal economic forces have caused analysts to revise recession forecasts (that were abundant though the early half of 2023) to more tame predictions of a mere slowdown.
Equity Market Performance
The last few months have seen a volatile whipsaw in equities, providing many profitable trading opportunities for active managers. I expected the S&P 500 index to spend more time digesting the rapid retracement it experienced in October, especially considering the bearish narrative regarding term premium risk that was regurgitated repetitively by the financial news media complex. However, after reaching extremely oversold conditions in late October with less than 10% of S&P 500 stocks above their 50-day moving average, equity markets contorted to equally extreme overbought conditions with more than 90% of S&P 500 stocks now above their 50-day moving average (see exhibit below).
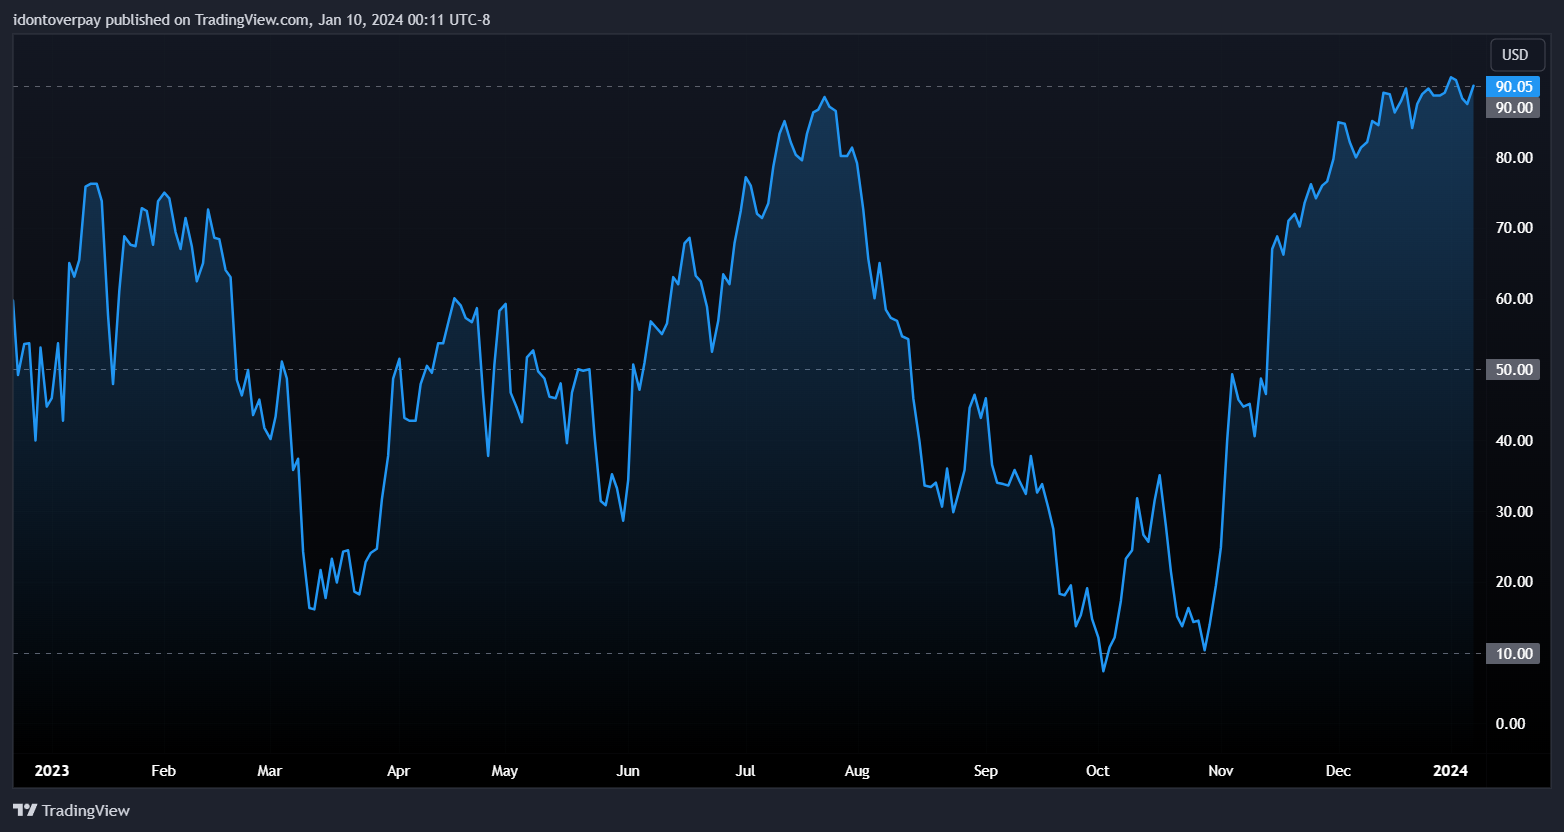
Diving into technicals, the S&P 500 found support at its previous breakout level of 4100 and has not looked back since (see exhibit below). This rapid appreciation communicates impatient demand as opposed to the tepid accumulation previous seen at the 4100 key level. After this upward drive, the market’s momentum continued through the quiet holiday weeks on exceptionally low volume, uniform to Santa rally seasonality. The first week of 2024 saw more profit-taking in the usual tax-loss selling period, but volume remained low, exemplifying that more patience may be present in market participants at current valuations.

Although there could be significant volatility this year if rate expectations are revised upward or a recession rears, many indicators are signalling higher prices. Fundstrat’s bull-leaning strategist Tom Lee, who nailed predictions for 2023, predicts the S&P 500 will reach 5200 by the end of 2024, implying a 9% upside from current levels. According to Tom, since 1900 stocks have achieved >10% returns when 10-Year Treasury Yields are between 3-4%, and the average P/E ratio of the S&P 500 has been >20x half the time that 10-Tear Notes trade in this range. There also tends to be strong momentum in the second year of a bull run. The average S&P 500 return for the second year of a bull market since the 1930’s is 12.64%, and only 3 of the past 20 similar instances led to negative years with the last instance occurring in 1962 (see exhibit below). As the character Old Turkey wisely states in Edwin Lefèvre’s 1928 classic, “It’s a bull market, you know.”

Dollar-Equity Inverse Correlation
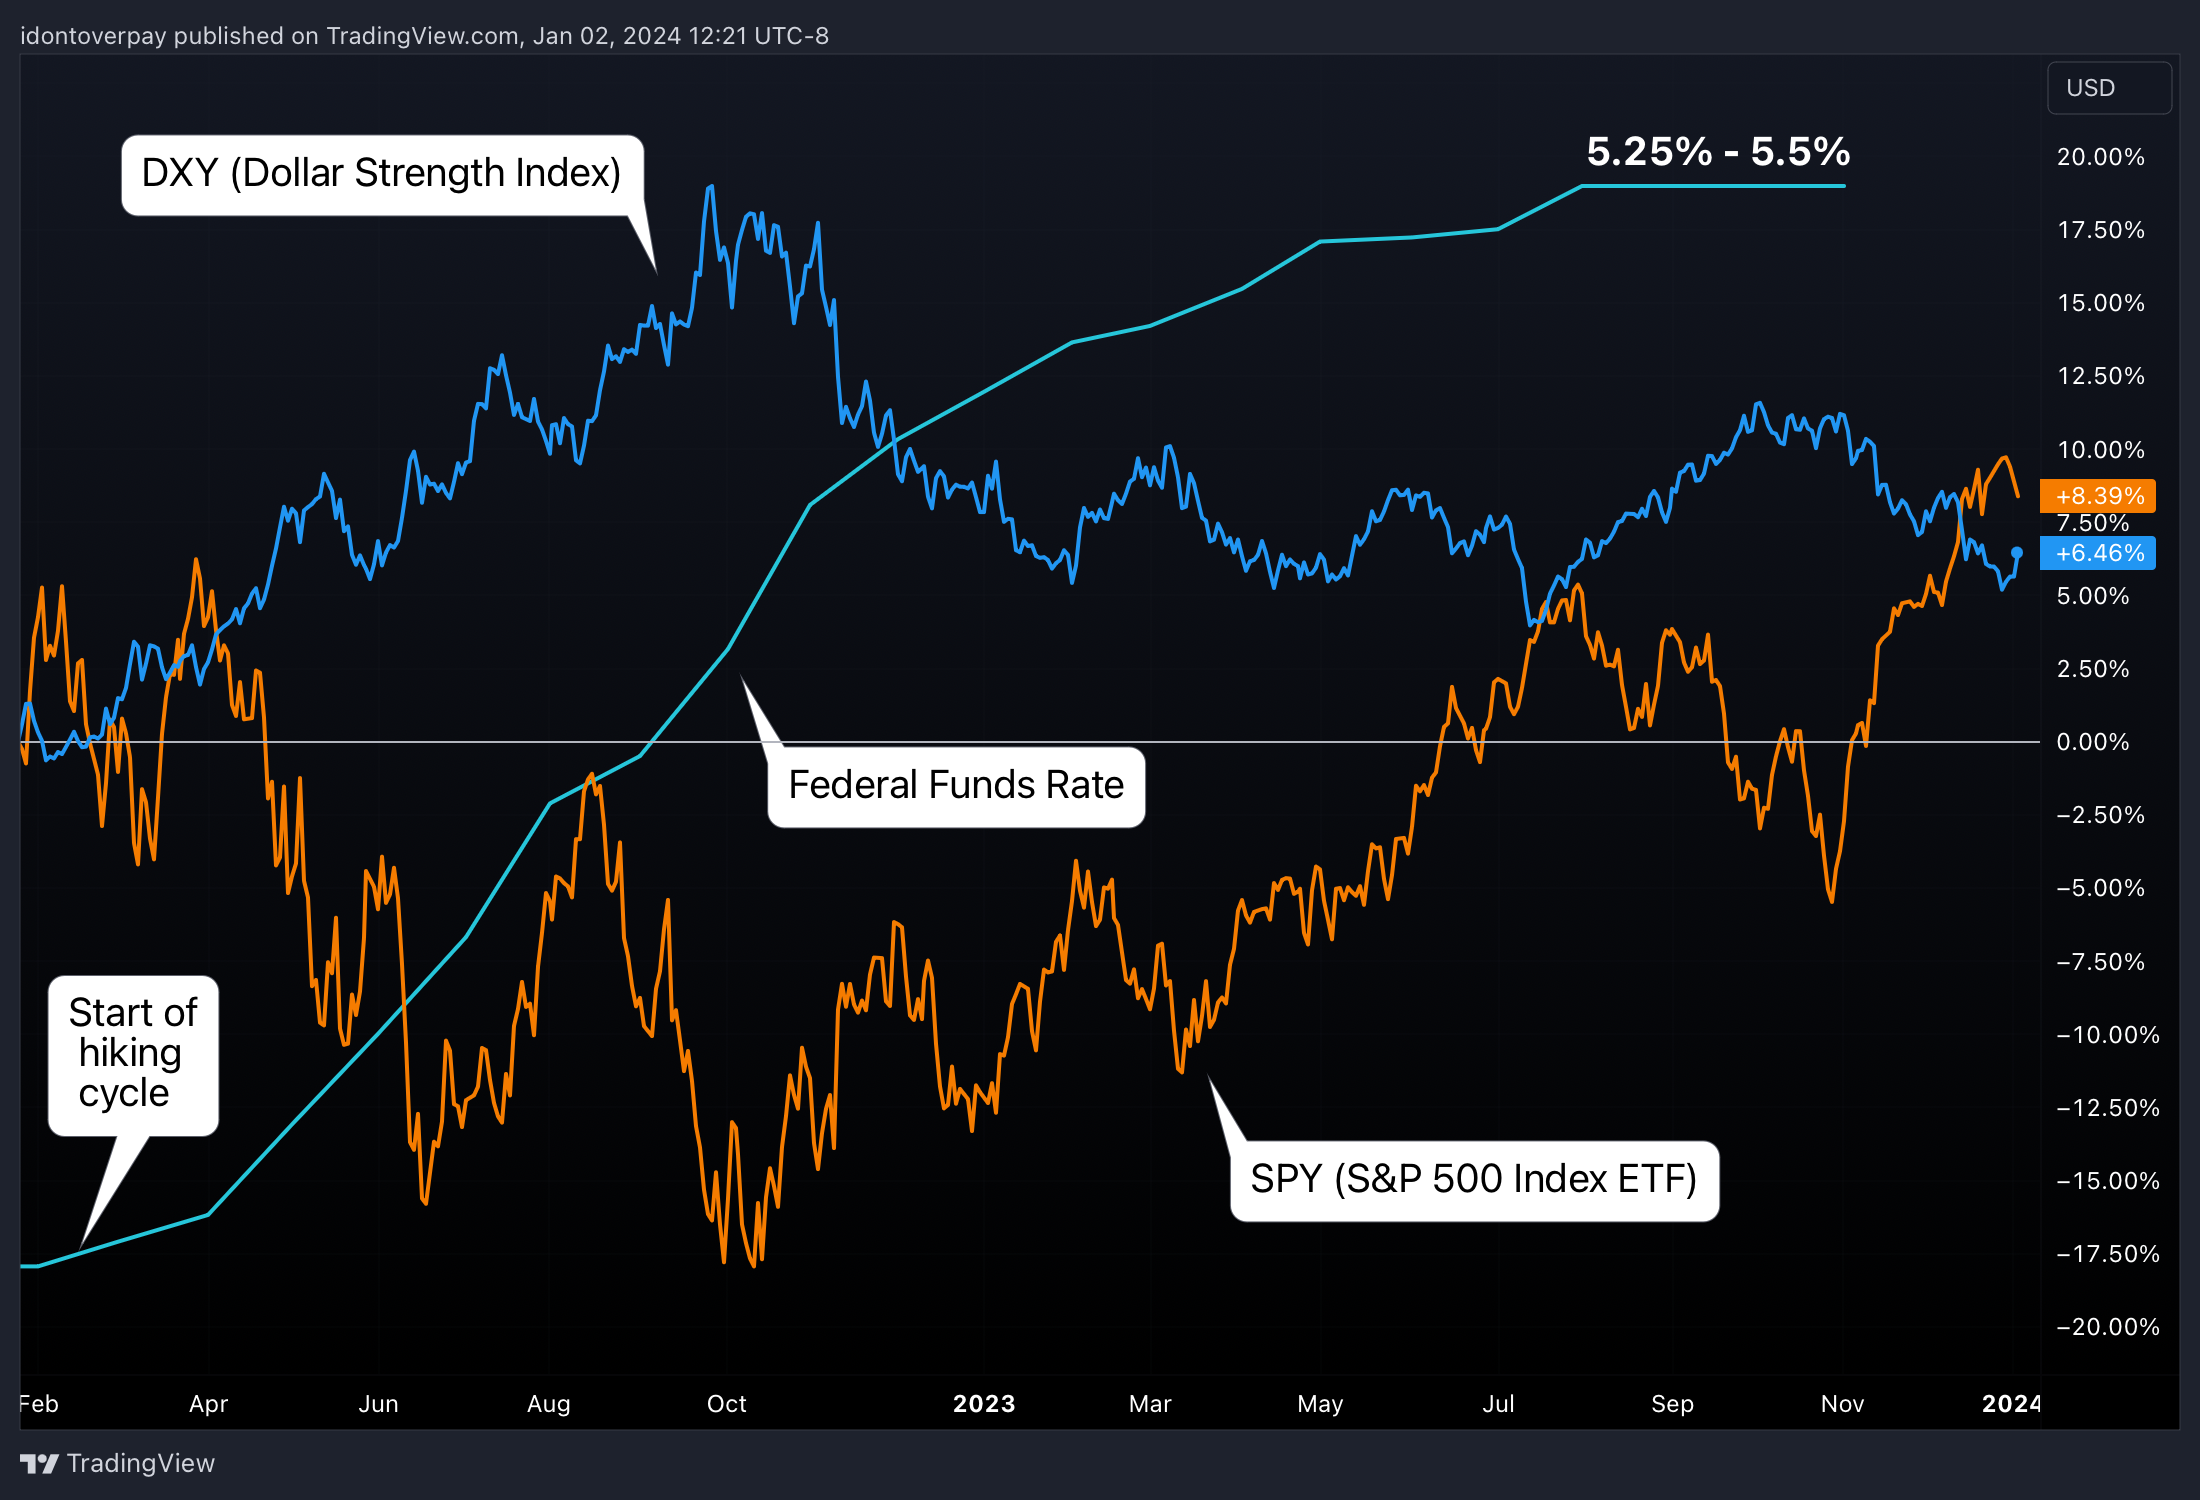
The Federal Reserve’s Hawkish campaign has been an undeniable fundamental tailwind for the US Dollar since the very beginning of the hiking cycle, as when investors can get a higher return on their dollars, they are willing to pay more for them. In parallel, US equity performance has been dampened by the cycle. The lower returns from equities in this kind of environment are traditionally attributed to excess return compression relative to excess risk beyond the risk-free rate. Some even attribute the lower returns to the tightening effects of monetary policy on businesses, but I would argue that the long and variable lags of this central bank lever do not explain the drastic changes in valuations, especially the recent bull run in December. A third and less commonly referenced explanation for the rejuvenated equity market is simply inflation, and this better explains the inverse correlation observable between US Dollars and Equities (see exhibit below). As the Fed starts cutting rates, the effects of fiscal stimulus previously undermined by higher rates will begin to impact the value of US Dollars, making each dollar buy fewer real assets, and thus less shares.
Gold Notches New All-Time High
Commodity prices are further supporting my thesis noted in the previous section as they continue to appreciate. Gold has a unique position as a hedge against economic uncertainty and is less cyclical compared to other commodities. In December Gold had its highest-ever monthly close, and futures continue to trade constructively near recently tagged all-time highs (see exhibit below). Usually, the spike and selloff that it experienced at highs would be considered a blow off top signalling a reversal to the downside, but the halt of price action near the same level indicates that buyers are stepping in. Given these circumstances and the continuing geopolitical conflict, it seems that aurum has never been a more important element in portfolio construction.

Bitcoin Goes Wall Street
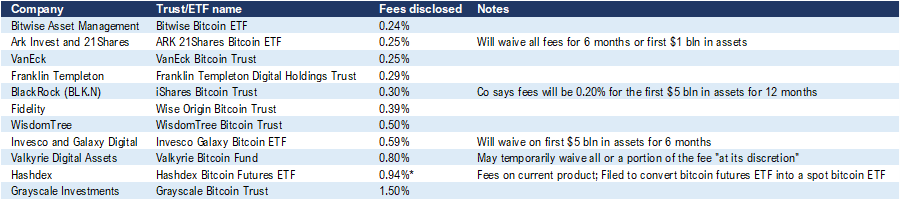
Juxtaposed to the value proposition of decentralization that makes Bitcoin unique, this week the market is awaiting a decision from the SEC regarding spot exchange-traded fund filings that is anticipated to occur later today. If approved, these new Bitcoin ETF’s could see over $100 billion of inflows by the end of the year. Many crypto bulls are hailing this as a huge victory for adoption, but others are worry that these centralized products could open the door to manipulation from central governments and other large entities. Ever since Kim Kardashian was charged with securities fraud (for pumping Emax tokens in October 2022) the US Government has taken a larger interest in crypto, and a decision to allow these ETF’s could expand their reach. Due to the first-mover advantage experienced by previous ETF releases, it seems that the funds vying for approval will likely be first available to investors at the same time. Below is a list of the ETF’s and their fee structures for comparison.
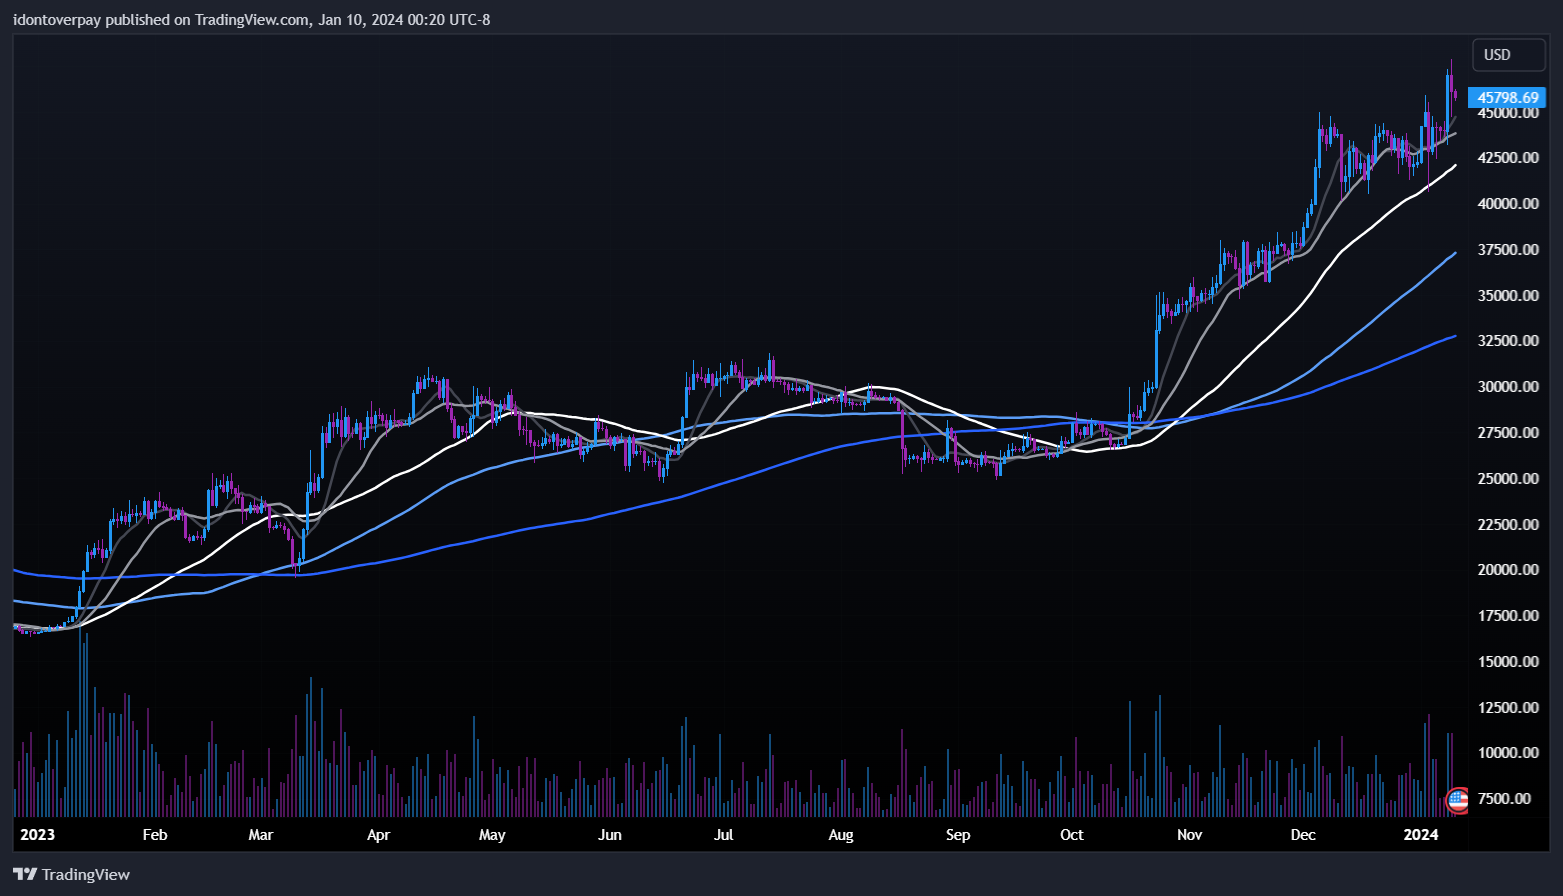
After surging higher in October, Bitcoin held its gains and grinded higher throughout November with volatility contracting into a high tight flag. On December 1st it broke the highs of this formation on increasing volume, adding another leg to its bull run. Through December Bitcoin experienced another volume contraction and basing pattern, notching one fake-out on January 2nd before breaking out to new highs again on January 8th (see exhibit below). The current trend remains strong, and the next halving date is expected on April 19, 2024. This event is a scarcity mechanism designed to control inflation within the cryptocurrency ecosystem and will reduce the rewards for mining new Bitcoins to half of the current level, which historically coincides with a run-up in price in anticipation of the event.
Although everything seems bullish right now, sentiment always follows price. If the markets start tumbling, so will expectations. Practice prudent hygiene to avoid catching the Fed Pivot Fever!

I hope you enjoyed this month’s newsletter. You can sign up for the same charting software I use here, or view my macro watchlist for free here.